
downtown data
Visitation Data
q4 2025
*Data above includes visits from residents, workers, and visitors longer than 10 minutes to the downtown core of Rochester, NY.
Source: Placer.ai | Period: 10/01/25 - 12/31/25
2025 SNAPSHOT
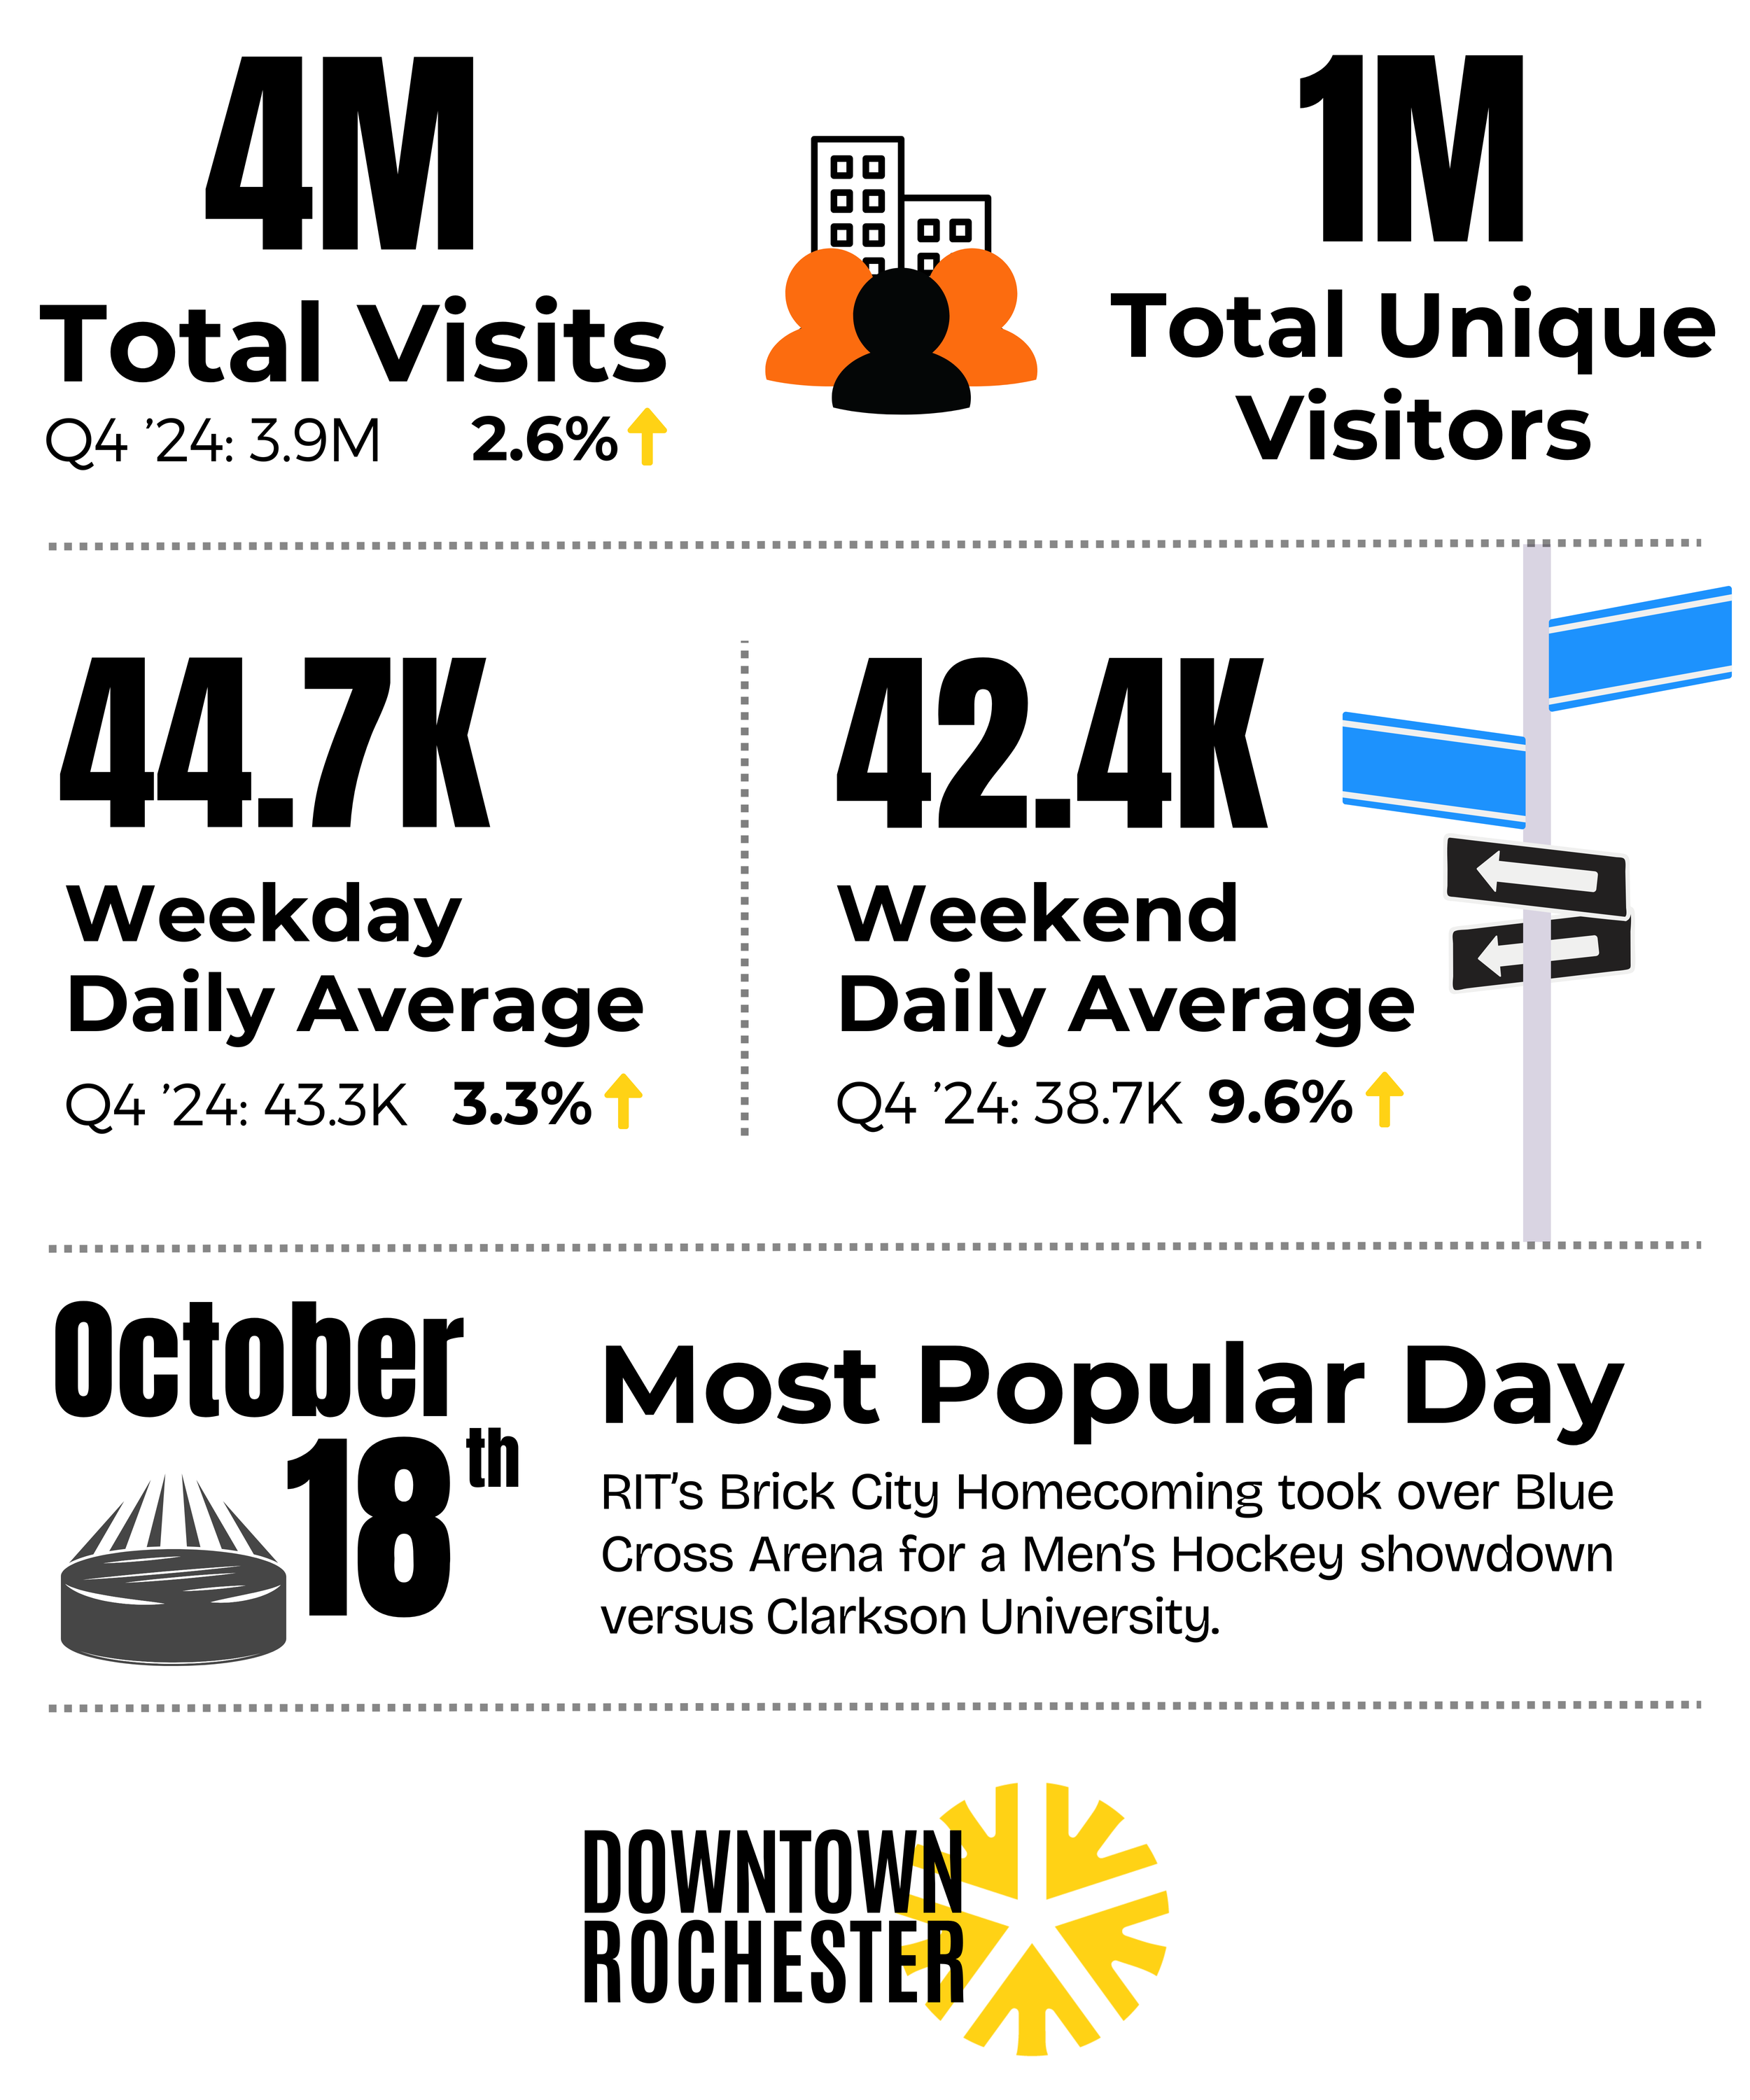
16.5M
Total Visits
7.1% Increase Year-Over-Year
2.2M
Total unique visitors
Total Visits, 2019 - 2025
46.3K
weekday daily average
6.9% Increase Year-Over-Year
42.1K
Weekend daily average
7.4% Increase Year-Over-Year
*All visits include residents, workers, and visitors to the downtown core. Source: Placer.ai
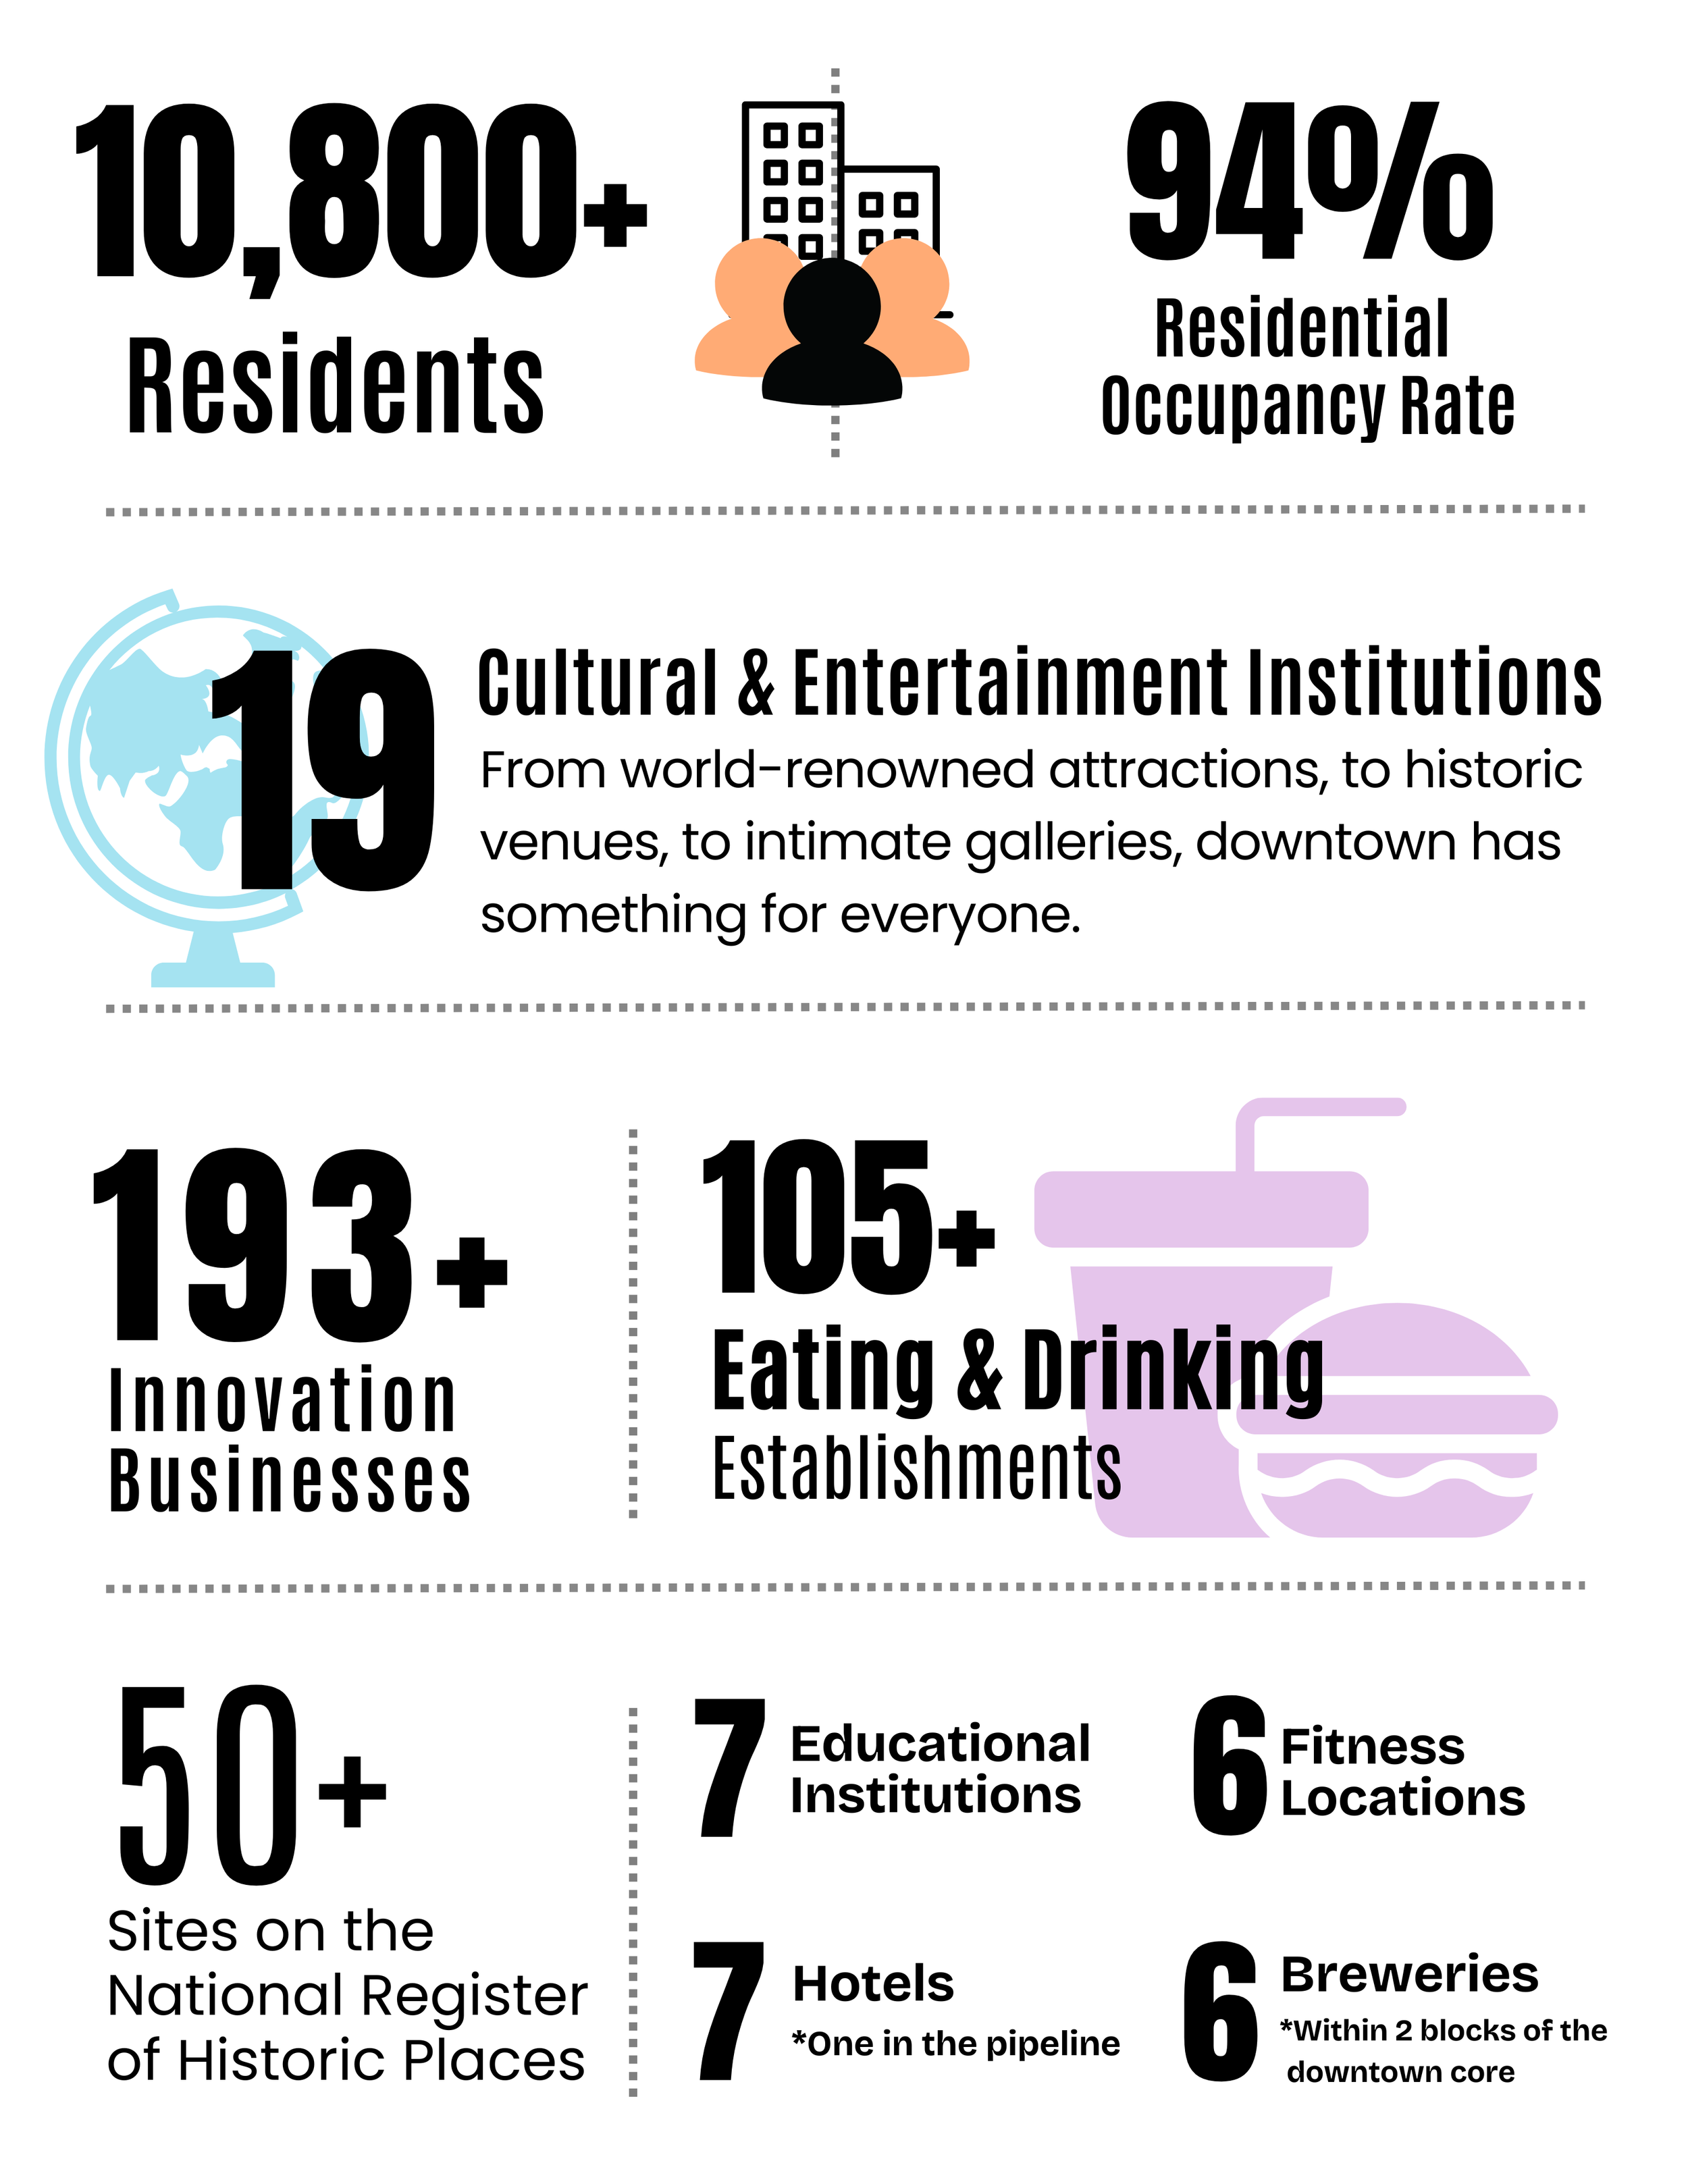
20 new ground floor businesses
opened in the heart of downtown in 2025
$491+ million downtown investment
in announced and completed projects in 2025
DOWNTOWN BY THE NUMBERS
2024 SNAPSHOT
15.4M
Total Visits
2.2M
Total unique visitors
43.3K
Weekday Daily Average
39.2K
Weekend Daily Average
*Unless otherwise stated, all visits include residents, workers, and visitors to the downtown core. Source: Placer.ai
RDDC CORPORATE INFORMATION
-
-
-
-
Established in 2021, the Partnership for Downtown Rochester is a public private partnership between New York State, Empire State Development, the City of Rochester, RDDC, and ROC2025.
The Partnership was created to facilitate placemaking efforts, coordinate marketing and programming, and lead promotion of activities throughout downtown Rochester and along the Genesee Riverway. The Partnership’s goal is to increase private sector participation to better activate public spaces and help guide the revitalization of Rochester for the benefit of downtown stakeholders, visitors, and the overall community. The Partnership for Downtown Rochester is a 501(c)(3) nonprofit organization.
Click here to visit the partnerships website